Announcements
The Nuclear Medicine Technology Certification Board Has Developed a Post-Primary Computed Tomography (CT) Credential.
Read moreDavid Perry, CNMT, PET
The Nuclear Medicine Technology Certification Board (NMTCB) undertook to conduct a fairly comprehensive survey of nuclear medicine technologists during the summer of 2012. The survey was delivered online using Open Source LimeSurvey software (http://www.limesurvey.org/). It was divided into three primary categories seeking information on demographics, education and training, and job status and salary. Invitations to participate in this survey were sent via email to 21,383 active certificants for whom the NMTCB has a valid email address. Of those, 4,469 completed all or part of the online survey for a response rate of 20.8%.
All surveys were subjected to the simple analysis provided by the LimeSurvey software. The output data were also converted to a Microsoft Excel 2010 workbook and analysis of the data was performed using Excel data analysis functions. Blank response entries were maintained but individual records containing blank data were not used in any analysis that required the missing data. As a result, any cross-tabulated statistics reported here do not use any information provided by those respondents who did not complete the appropriate items needed to make that analysis. Their record may, however, have been used in the analysis of other questions for which the responses were deemed appropriately sufficient. It should be recognized that since the records used in any one specific analysis may differ from those used in another analysis, output values for the same statistic may vary somewhat from one table to another. Salary data crossed referenced with different demographic variables may produce differing median or mean salaries for any given group of nuclear medicine technologists.
Of all respondents, 56.74% identified themselves as female. However, of the 2,673 (59.8%) respondents who claimed to be employed full-time (>35 hours per week), 53.27% identified themselves as female, while 295 of 433 (68.28%) of those working part-time (20-35 hours per week) are female and 67.16% of those working per diem (less than 20 hours per week) are female. As is shown in Chart 1, the age range is spread rather evenly through all age groups except those at the extreme ends of the range options.
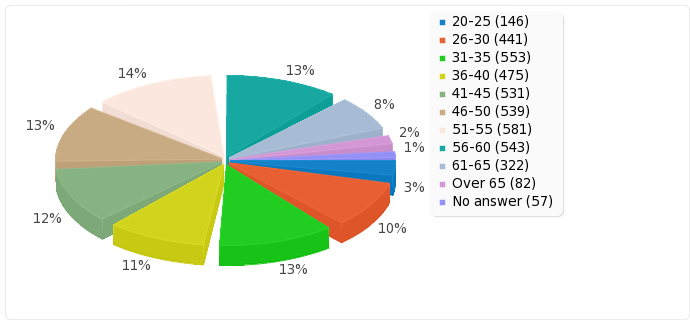
Chart 1 - Age of Respondents
As shown in Chart 2, more than 75% of all respondents listed their ethnic origin as being "White, not of Hispanic Origin", and nearly 4% did not answer the question. Of the remaining 15%, their numbers were almost exactly evenly divided between African-American, Asian or Pacific Islander, and Latino or Hispanic.
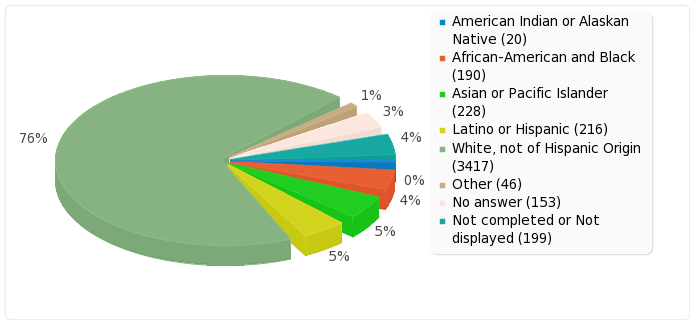
Chart 2 - Ethnicity of Respondents
Participants were also asked how the type of population base the area where they are employed can best be described. Of the respondents, 36.25% claimed to work in an urban area, while 30.19% work in a suburban area and 8.08% work in a rural area.
Just under half (49.25%) of all who answered the survey belong to the Society of Nuclear Medicine and Molecular Imaging Technologist Section (SNMMITS), while 16.63% belong to the American Society of Radiologic Technologists (ASRT) and 5.37% belong to the American Society of Nuclear Cardiology (ASNC). Less than 1% belong to any of the other professional organizations, with the exception of the American Healthcare Radiology Administrators (AHRA), to which 1.54% belong.
When asked "What is the highest level of formal education you have completed as of this date?", 48.67% claimed to hold a Baccalaureate Degree while another 30.08% claimed to hold an Associate's Degree. Another 9.41% have a Master's Degree and 9.2% hold a certificate of completion or program diploma as their highest level of formal education. Just less than 1% have completed doctoral or post-doctoral education. These data are displayed graphically in Chart 3. When participants were asked whether they are currently in pursuit, or are planning to pursue, additional degree(s), 23.54% said Yes, while 42.52% said No and 23.11% aren't sure.
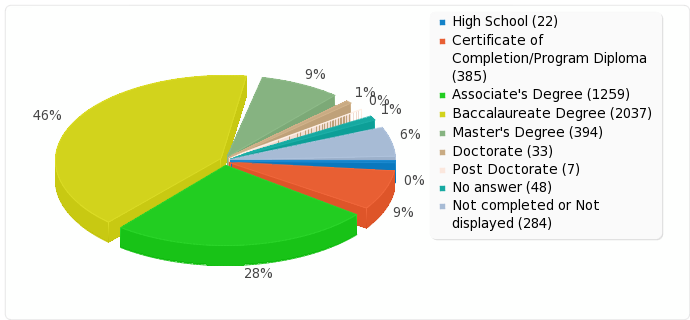
Chart 3 - Highest Level of Education
Technologists were also invited to describe the type of nuclear medicine education they receivedto which 30.99% claimed a degree from a 4-year college or university. An additional 26.12% went to a community or junior college while 13.02% went to a hospital or medical center-based program. Training on the job remains the initial source of nuclear medicine technology training for 9.84% of respondents, while 2.56% received their training in the military and 13.84% attended a program at a teaching hospital associated with a university. When asked whether the nuclear medicine technology program that they attended was programmatically accredited, 64.92% stated that their program was programmatically accredited at the time of graduation. Participants were also asked what year they graduated from their nuclear medicine technology education program. Chart 4 graphically demonstrates the year in which respondents graduated from their nuclear medicine program.
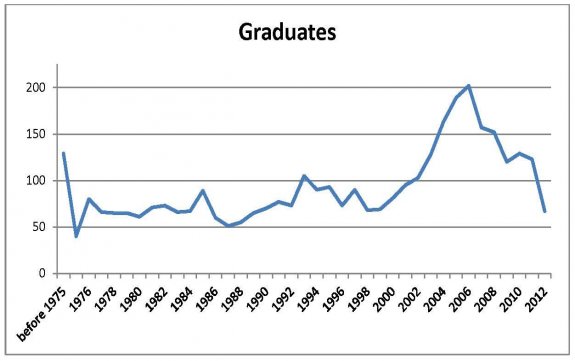
Chart 4 - In what year did you graduate from a nuclear medicine technology education program?
When asked "If you graduated from a nuclear medicine technology education program, what did you receive upon completion of that program?", the responses were very evenly distributed, with 26.4% receiving a Baccalaureate Degree (with or without a certificate of completion), 29.08% receiving an Associate's Degree (with or without a certificate of completion) and 30.56% receiving a Certificate of Completion/Diploma only.
Survey participants were asked "Approximately how many years of college had you completed BEFORE you started your formal nuclear medicine technology education (choose the closest option)?" Chart 5 shows the amount of college attended by participants prior to starting nuclear medicine technology education.
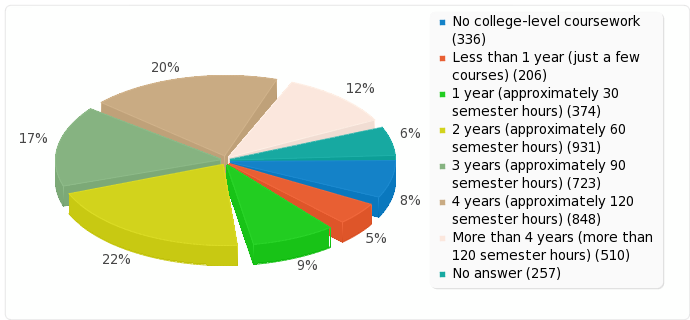
Chart 5 - How many years of college completed BEFORE starting nuclear medicine training.
It is natural to expect that most survey participants would be NMTCB certified (CNMT) and, indeed, 91.25% of respondents said that they are. In addition, 5.24% of respondents are NCT certified, 4.68% are certified in PET and 0.11% are NMAA certified. Those certified in nuclear medicine by the American Registry of Radiologic Technologists (ARRT) comprised 35.65% of the respondents, suggesting that as many as about a third of nuclear medicine technologists hold NMT certification/registry with both the NMTCB and the ARRT. Certification as a Registered Radiographer made up 22.98% of respondents, as compared to (24.37%) of all respondents that were Registered Radiographers (RT(R)) prior to starting nuclear medicine training, suggesting that almost all (94.3%) of the nuclear medicine technologists that started as radiographers have retained that registry. Three hundred twenty one respondents (7.18%) are also registered in computed tomography. This suggests an increase over the approximately 200 nationally that were registered in CT a decade ago. Interestingly, 85 nuclear medicine technologists (1.9%) are also registered with the ARRT in MR. Other certification/registries listed include Radiation Therapy (0.13%), Cardiovascular Interventional Radiography (0.25%), Mammography (1.61%), Diagnostic Medical Sonography (1.19%, Diagnostic Cardiac Sonography (0.31%), Vascular Sonography (0.43%) and MR with ARMRIT (0.11%). In addition, 48 nuclear medicine technologists registered with the Canadian Association of Medical Radiologic Technologists (CAMRT) responded to the survey, comprising 0.29%. We also had a small number of responses from those registered with CAMRT in radiography, MR and radiation therapy.
The third section of the 2012 Certificant Survey sought to answer some questions about the employment and job status of nuclear medicine technologists. When asked "Which of the following categories BEST describes your current employment status in a field related to nuclear medicine technology?" 60.08% responded that they were considered full-time or full-time equivalent. Part-timers (routinely less than 40 hours per week) made up 9.71% of respondents, while PRN (called to work only when needed) made up 6.24% of respondents. It may be important to note that 9.0% of survey respondents chose "No Answer" to this question while an additional 9.78% did not respond to this question at all. During the survey, participants were given the option to end the survey after the Certificant/Registry section if they were not employed in a field related to nuclear medicine technology. Also, 5.19% of respondents chose "Other". While a few of those list health care related jobs such as MRI, PACS, Electronic Records, Medical Physics and even an owner of a NM related business, the overwhelming majority of those that chose "Other" stated that they cannot find work in an nuclear medicine technology related field. These data are shown in Chart 6.
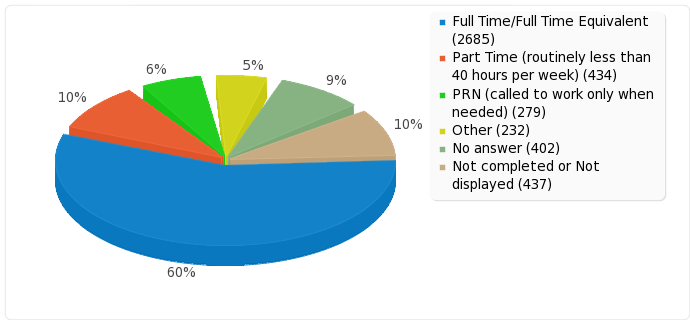
Chart 6 - Current Employment Status
We then asked "If you responded "Part Time" or "PRN" to the previous question, what is the average number of hours per week that you work in a field associated with nuclear medicine technology?"The responses are broken down and displayed in Table 1.
|
Answer |
Count |
Percentage |
|
0-5 hours per week |
91 |
2.04% |
|
6-10 hours per week |
89 |
1.99% |
|
11-15 hours per week |
70 |
1.57% |
|
16-20 hours per week |
105 |
2.35% |
|
21-25 hours per week |
137 |
3.07% |
|
26-30 hours per week |
93 |
2.08% |
|
31-35 hours per week |
92 |
2.06% |
|
36-39 hours per week |
48 |
1.07% |
Table 1 - Average Number of Hours per Week for Part-Time and PRN NMT Employees
Hospital based general imaging is the primary job classification of 38.46% of respondents, while 10.72% work in an office based cardiac only setting. The remainder of survey participants who chose to answer this question (more than 30% did not) are spread across a variety job settings. Of the 1014 (22.69%) respondents who consider themselves employed in an administrator role, 71.8% of them say they are actively involved in performing routine clinical procedures as well as having significant administrative duties, while 13% are not actively involved in performing routine clinical procedures. Whereas 22.35% of all respondents state that the clinical instruction/training of nuclear medicine technology is an official part of their job duties, 151 respondents (0.03%) claim their primary responsibility is in the role of an educator. Of those, 37% are Program Directors, 23.8% are Clinical Coordinators, 15.8% are Classroom Instructors, and 23.1% were hired specifically to both instruct students in the clinical setting and in the classroom. There were 183 (0.04%) respondents who work as nuclear medicine technologists in the private sector. Of these, 183 (8.7%) work as sales/marketing professionals, 20.7% work as applications specialists, 26.7% work as administrative professionals, 1.6% work as systems analysts or programmers and 42% who work in a variety of other roles such as accreditation specialist, technical consultant/speaker, RSO, imaging scientist, regulatory compliance, field service engineer, state regulator, quality assurance auditor, and a number of independent technologist positions.
When asked the question "How long have you held your CURRENT position with your CURRENT employer?" responses peaked at 6-10 years as shown in Table 2.
|
Answer |
Count |
Percentage |
|
Less than 1 year |
330 |
7.38% |
|
1-3 years |
490 |
10.96% |
|
3-5 years |
598 |
13.38% |
|
6-10 years |
1023 |
22.89% |
|
11-15 years |
496 |
11.10% |
|
16-20 years |
188 |
4.21% |
|
21-30 years |
281 |
6.29% |
|
More than 30 years |
117 |
2.62% |
Table 2 - Current Position with Current Employer
When asked "How long have you held ANY nuclear medicine or radiology-related position with your CURRENT employer?" the responses also peaked at 6-10 years as shown in Table 3.
|
Answer |
Count |
Percentage |
|
Less than 1 year |
242 |
5.42% |
|
1-3 years |
367 |
8.21% |
|
3-5 years |
529 |
11.84% |
|
6-10 years |
952 |
21.30% |
|
11-15 years |
521 |
11.66% |
|
16-20 years |
214 |
4.79% |
|
21-30 years |
320 |
7.16% |
|
More than 30 years |
179 |
4.01% |
Table 3 - Any Radiology Position with Current Employer
Lastly, respondents were asked "How long have you held ANY nuclear medicine or radiology-related position with ALL (past and current) employers?" While responses again peaked at 6-10 years, there were also many responses of more than 20 years, as shown in Table 4.
|
Answer |
Count |
Percentage |
|
Less than 1 year |
113 |
2.53% |
|
1-3 years |
196 |
4.39% |
|
3-5 years |
333 |
7.45% |
|
6-10 years |
725 |
16.22% |
|
11-15 years |
470 |
10.52% |
|
16-20 years |
428 |
9.58% |
|
21-30 years |
679 |
15.19% |
|
More than 30 years |
634 |
14.19% |
Table 4 - Any Radiology Position with Any Employer
Department sizes seem to vary as shown by Table 5, which displays the results to the question "How many total nuclear medicine technologists are currently employed by your institution? You may include administrators, educators and contract (agency) nuclear medicine technologists who maintain their (NMTCB and/or ARRT) certification?"
|
Answer |
Count |
Percentage |
|
1 |
429 |
9.60% |
|
2 |
451 |
10.09% |
|
3 |
422 |
9.44% |
|
4 |
381 |
8.53% |
|
5 |
287 |
6.42% |
|
6 |
224 |
5.01% |
|
7 |
200 |
4.48% |
|
8 |
160 |
3.58% |
|
9 |
100 |
2.24% |
|
10 |
160 |
3.58% |
|
11 |
56 |
1.25% |
|
12 |
72 |
1.61% |
|
13 |
23 |
0.51% |
|
14 |
35 |
0.78% |
|
15 |
44 |
0.98% |
|
16-20 |
118 |
2.64% |
|
21-25 |
56 |
1.25% |
|
26-30 |
30 |
0.67% |
|
31-40 |
19 |
0.43% |
|
41-50 |
14 |
0.31% |
|
more than 50 |
37 |
0.83% |
Table 5 - How Many NMT's Employed by your Institution?
As would be expected given the current fiscal environment, there were not many unfilled nuclear medicine technologist jobs at the time the survey was conducted as described in Table 6, which shows responses to the question "How many vacant FULL TIME nuclear medicine technologist positions does your institution currently have (that they plan to fill)?"
|
Answer |
Count |
Percentage |
|
0 (none) |
3007 |
67.29% |
|
1 |
146 |
3.27% |
|
2 |
76 |
1.70% |
|
3 |
37 |
0.83% |
|
4 |
27 |
0.60% |
|
5 |
16 |
0.36% |
|
More than 5 |
46 |
1.03% |
|
Don't know |
76 |
1.70% |
Table 6 - How Many Open Full-Time Positions at your Institution?
Likewise, it doesn't seem there were very many open part-time or PRN positions open in 2012 either, as shown in Tables 7 and 8 respectively.
|
Answer |
Count |
Percentage |
|
0 (none) |
3129 |
70.02% |
|
1 |
125 |
2.80% |
|
2 |
43 |
0.96% |
|
3 |
12 |
0.27% |
|
4 |
7 |
0.16% |
|
5 |
2 |
0.04% |
|
More than 5 |
12 |
0.27% |
|
Don't know |
88 |
1.97% |
Table 7 - How Many Open Part-Time Positions at your Institution?
|
Answer |
Count |
Percentage |
|
0 (none) |
2874 |
64.31% |
|
1 |
301 |
6.74% |
|
2 |
68 |
1.52% |
|
3 |
17 |
0.38% |
|
4 |
8 |
0.18% |
|
5 |
2 |
0.04% |
|
More than 5 |
8 |
0.18% |
|
Don't know |
120 |
2.69% |
Table 8 - How Many Open PRN Positions at your Institution?
Approximately one-third (32.94%) of survey participants stated that they take call, and most get $2-$3.00 per hour for "carrying the beeper" as shown in Table 9.
|
Answer |
Count |
Percentage |
|
$0 (nothing for carrying the beeper) |
55 |
1.23% |
|
$1.00 per hour |
63 |
1.41% |
|
$2.00 per hour |
528 |
11.81% |
|
$3.00 per hour |
440 |
9.85% |
|
$4.00 per hour |
150 |
3.36% |
|
$5.00 per hour |
133 |
2.98% |
|
$6.00 per hour |
39 |
0.87% |
|
$7.00 per hour |
22 |
0.49% |
|
$8.00 per hour |
26 |
0.58% |
|
$9.00 per hour |
9 |
0.20% |
|
$10.00 per hour |
10 |
0.22% |
|
$11.00 per hour |
2 |
0.04% |
|
$12.00 per hour |
8 |
0.18% |
|
$13.00 per hour |
0 |
0.00% |
|
$14.00 per hour |
2 |
0.04% |
|
$15.00 per hour |
5 |
0.11% |
|
Greater than $15.00 per hour |
39 |
0.87% |
Table 9 - "Beeper Pay"
When responding to an emergency request for a nuclear medicine procedure, most respondents get straight overtime (1.5 time regular hourly rate) as described in Table 10. Among those that answered "Other" the majority had a minimum number of hours (usually 3 or 4) associated with each call in.
|
Answer |
Count |
Percentage |
|
Straight time |
171 |
3.83% |
|
Time and one half |
1168 |
26.14% |
|
Double time |
36 |
0.81% |
|
A fixed rate per hour not directly associated with your annual base salary |
34 |
0.76% |
|
A fixed rate per study (rather than per hour) |
29 |
0.65% |
|
Other |
76 |
1.70% |
Table 10 - Compensation for Emergency Procedures
Participants were asked if they were paid a "shift differential" in addition to hourly wages. Chart 7 displays the results.
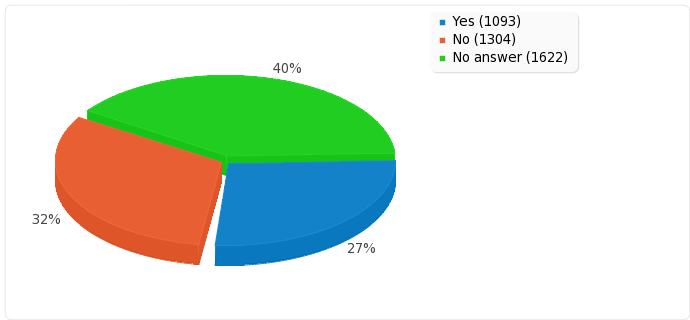
Chart 7 - Paid Shift Differential in Addition to Hourly Wage
Salary
The last section of the survey was about salaries. All participants were asked for their current annual base salary. The mean annual salary range among those claiming to work full-time in a field related to nuclear medicine certification was $70,000 - $74,999. The distribution of annual salaries among all participants, including part-time and PRN technologists was also tabulated. The results are shown in Table 11.
|
Answer |
Count |
Percentage |
|
0-$9,999 |
58 |
1.30% |
|
$10,000 - $19,999 |
54 |
1.21% |
|
$20,000 - $29,999 |
78 |
1.75% |
|
$30,000 - $39,999 |
120 |
2.69% |
|
$40,000 - $49,999 |
244 |
5.46% |
|
$50,000 - $54,999 |
232 |
5.19% |
|
$55,000 - $59,999 |
256 |
5.73% |
|
$60,000 - $64,999 |
392 |
8.77% |
|
$65,000 - $69,999 |
358 |
8.01% |
|
$70,000 - $74,999 |
358 |
8.01% |
|
$75,000 - $79,999 |
259 |
5.80% |
|
$80,000 - $84,999 |
242 |
5.42% |
|
$85,000 - $89,999 |
187 |
4.18% |
|
$90,000 - $99,999 |
212 |
4.74% |
|
$100,000 or more |
261 |
5.84% |
|
No answer |
721 |
16.13% |
|
Not completed or Not displayed |
437 |
9.78% |
Table 11 - Annual Base Salary
Specialty Certification
While we only asked for salary ranges and not more specific salary information, the data does suggest that those full-time technologists with NCT certification make 3.7% more than those without NCT certification and those with PET certification make 9.9% more than those without PET certification. Table 12 shows the median salary range for full-time nuclear medicine technologists in each state.
|
State |
Median Salary Range |
N = |
|
Alaska |
$90,000-$99,999 |
2 |
|
Alabama |
$60,000-$64,999 |
50 |
|
Arkansas |
$65,000-$69,999 |
27 |
|
Arizona |
$70,000-$74,999 |
45 |
|
California |
$100,000 or more |
122 |
|
Colorado |
$75,000-$79,999 |
39 |
|
Connecticut |
$80,000-$84,999 |
36 |
|
District of Columbia |
$85,000-$89,999 |
4 |
|
Delaware |
$70,000-$74,999 |
6 |
|
Florida |
$70,000-$74,999 |
160 |
|
Georgia |
$70,000-$74,999 |
62 |
|
Hawaii |
$80,000-$84,999 |
7 |
|
Iowa |
$70,000-$74,999 |
44 |
|
Idaho |
$60,000-$64,999 |
12 |
|
Illinois |
$65,000-$69,999 |
96 |
|
Indiana |
$65,000-$69,999 |
71 |
|
Kansas |
$60,000-$64,999 |
29 |
|
Kentucky |
$60,000-$64,999 |
67 |
|
Louisiana |
$60,000-$64,999 |
27 |
|
Massachusetts |
$75,000-$79,999 |
51 |
|
Maryland |
$75,000-$79,999 |
51 |
|
Maine |
$70,000-$74,999 |
18 |
|
Michigan |
$65,000-$69,999 |
115 |
|
Minnesota |
$75,000-$79,999 |
57 |
|
Missouri |
$70,000-$74,999 |
66 |
|
Mississippi |
$75,000-$79,999 |
22 |
|
Montana |
$60,000-$64,999 |
8 |
|
North Carolina |
$65,000-$69,999 |
85 |
|
North Dakota |
$75,000-$79,000 |
4 |
|
Nebraska |
$55,000-$54,999 |
19 |
|
New Hampshire |
$75,000-$79,999 |
10 |
|
New Jersey |
$80,000-$84,999 |
63 |
|
New Mexico |
$70,000-$74,999 |
15 |
|
Nevada |
$80,000-$84,999 |
13 |
|
New York |
$70,000-$74,999 |
124 |
|
Ohio |
$65,000-$69,999 |
115 |
|
Oklahoma |
$60,000-$64,999 |
28 |
|
Oregon |
$75,000-$79,999 |
29 |
|
Pennsylvania |
$65,000-$69,999 |
145 |
|
Puerto Rico |
$40,000-$49,999 |
17 |
|
Rhode Island |
$80,000-$84,999 |
4 |
|
South Carolina |
$70,000-$74,999 |
29 |
|
South Dakota |
$60,000-$64,999 |
14 |
|
Tennessee |
$60,000-$64,999 |
64 |
|
Texas |
$65,000-$69,999 |
196 |
|
Utah |
$70,000-$74,999 |
18 |
|
Virginia |
$70,000-$74,999 |
73 |
|
Vermont |
$60,000-$64,999 |
3 |
|
Washington |
$85,000-$89,999 |
54 |
|
Wisconsin |
$70,000-$74,999 |
70 |
|
West Virginia |
$60,000-$64,999 |
26 |
|
All States |
$70,000-$74,499 |
2,515 |
Table 12 - Median Salary Range by State
In Table 13, we describe median salary range by years of experience.
|
Years of Experience |
Median Salary Range |
N= |
|
Less than 1 year |
$50,000-$54,999 |
35 |
|
3-5 years |
$55,000-$59,999 |
210 |
|
6-10 years |
$65,000-$69,999 |
533 |
|
11-15 years |
$70,000-$74,999 |
356 |
|
16-20 years |
$75,000-$79,999 |
309 |
|
21-30 years |
$75,000-$79,999 |
502 |
|
More than 30 years |
$75,000-$79,999 |
464 |
Table 13 - Median Salary Range by Experience
We hope you agree that this survey has provided a wealth of important information about the state of nuclear medicine technology as of 2012. It does not, however, provide some of the more specific salary information that appeared in the 2006 NMTCB Salary Survey.
The Nuclear Medicine Technology Certification Board Has Developed a Post-Primary Computed Tomography (CT) Credential.
Read moreCan I change my NMTCB CE reporting cycle to match my continuing education cycle with another organization?
Read moreOrder NMTCB replacement certificates, scrubs, polo shirts, patches, pins, mugs, and more.
Read more